Cloud Intelligence / AIOps Workshop
AIOps is defined as IT Operations with AI. Microsoft has an initiative to promote AIOps to the broader scientific community through supporting workshops in international conferences. These workshop programs feature well known data scientists and provide a forum for researchers and practitioners to present the state of research and practice in AI/ML for efficient and manageable cloud services, and network with colleagues.
My work for Microsoft ($294 billion revenue for 2025) with this project has:
- given identities for Microsoft's Cloud Intelligence, AIoT, and AIOps presence.
- resulted in more registrations for conferences and participation in workshops for those conferences.
- shown that my technical and art skills can create something useful and at the same time, meaningful.
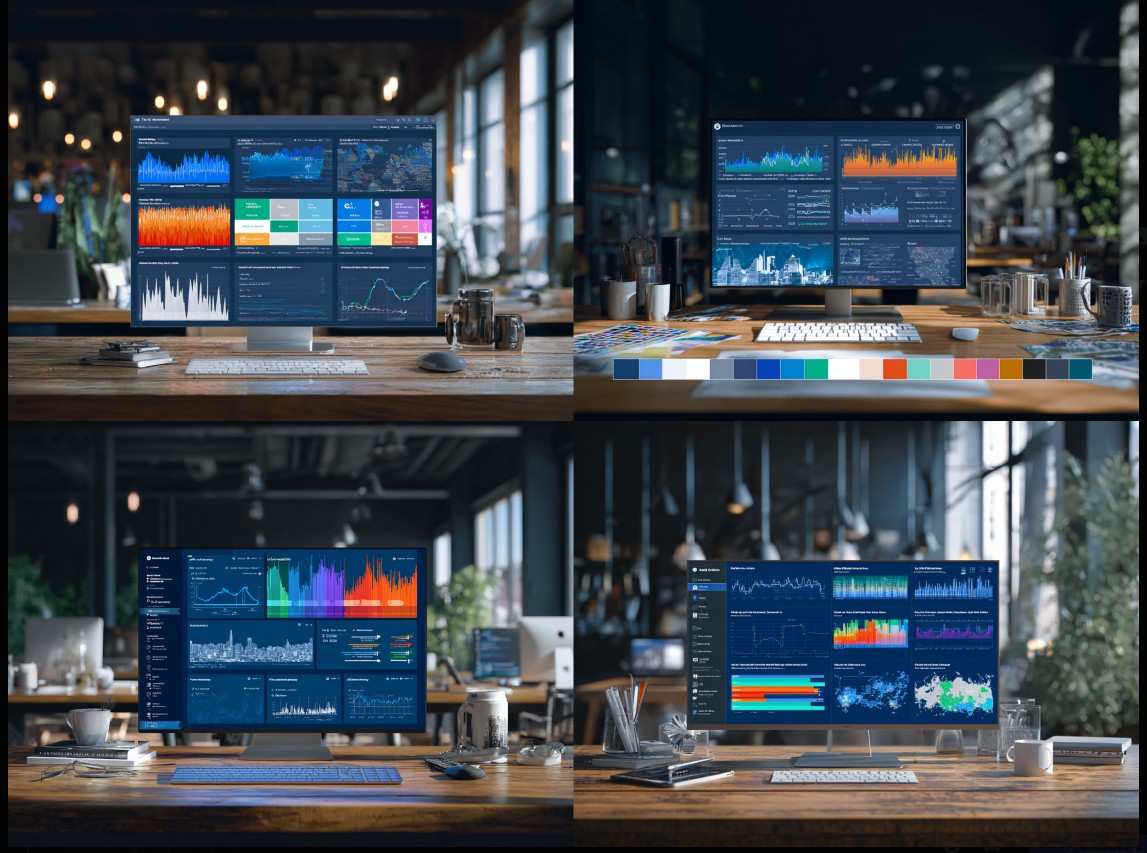
- provided the look for the Cloud Intelligence / AIOps Workshop including the website, hero, and collateral including the physical print brochure and poster.
- built and maintained site architecture, images, navigation, code (JavaScript, HTML, CSS).
- provided analytics reports and automatic site monitoring.
My Role: Product and Performance PM, Design, Development, Analytics
Tools and Languages: Adobe CC (Photoshop, Illustrator, Premiere Pro), Blender, SharePoint, HTML, CSS, JavaScript, ChatGPT, Midjourney, Python
Team: Me, Account Manager, Program Manager, Engineers, Professors, Researchers, Data Scientists
Challenge: Low Conference Engagement & Disjointed Web Presence
The issue was clunky, outdated, hard to navigate, websites. They also lacked the data insights needed to adapt or improve over time.
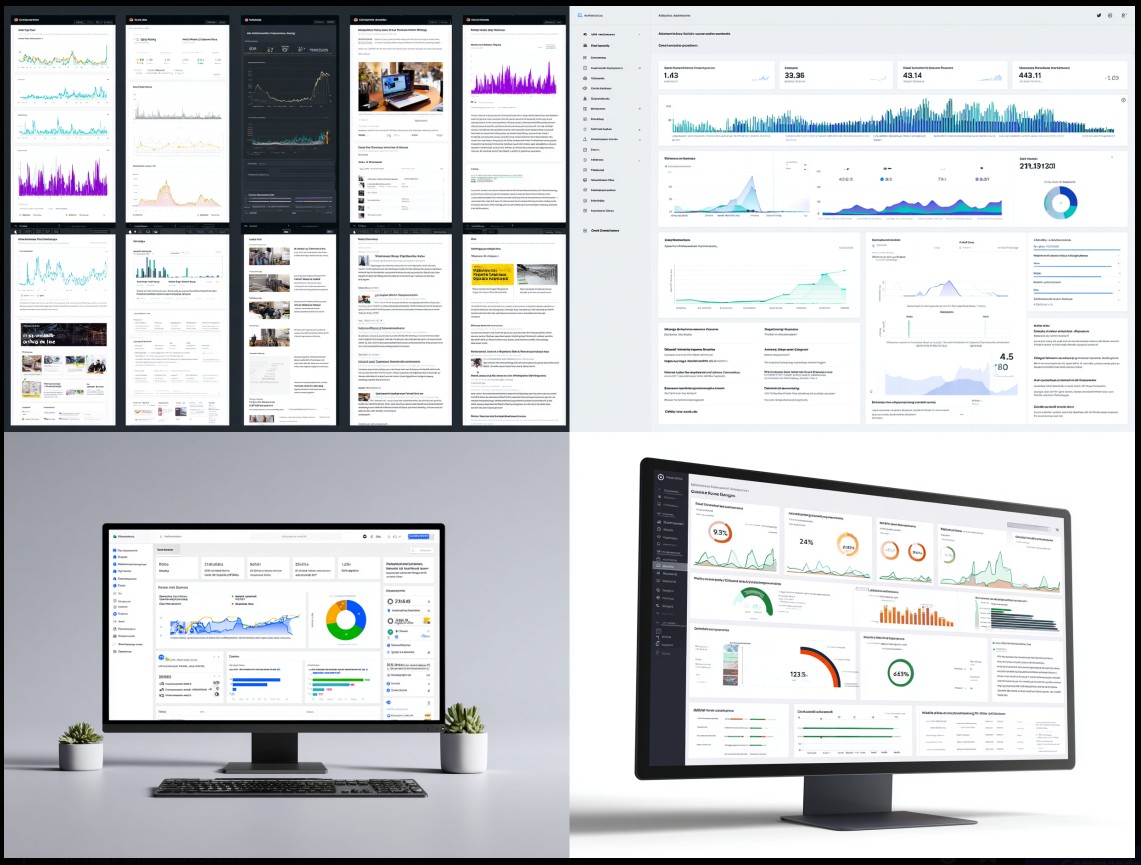
Process: Building User-friendly, Intuitive, More Engaging Conference Workshop Sites
To address the challenge, I completely overhauled site architecture by taking a comprehensive approach to redesigning and developing the sites. I crafted custom layouts using HTML, CSS, and JavaScript, optimized for both usability and speed.
Outcome: Higher Registrations, Better Engagement
The results were immediate and measurable. The redesigned workshop sites saw significant increases in conference registrations and workshop sign-ups. Organizers were able to use the insights from the analytics to adjust strategy in real-time, boosting participation even further. These websites didn’t just support the conferences but they became powerful tools in driving their success.
AIOps Design Guide and Social Media Campaign Analysis
I created a comprehensive design guides for the AIOps Workshops, which also included a detailed analysis of the social media campaign. The design guide served as a blueprint for the visual and user experience aspects of the workshop's online and physical presence, while the social media campaign analysis provided insights into engagement metrics and audience reach.
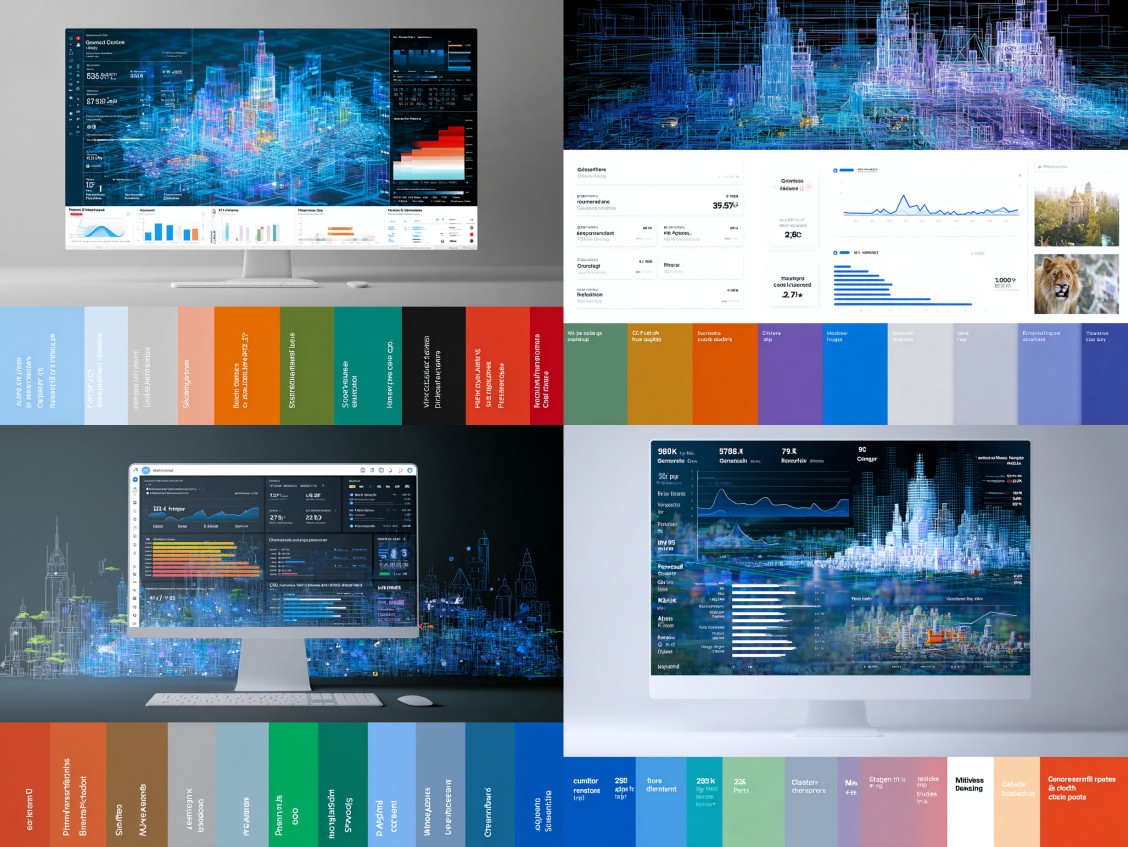
AIOps Conference Workshop Sites
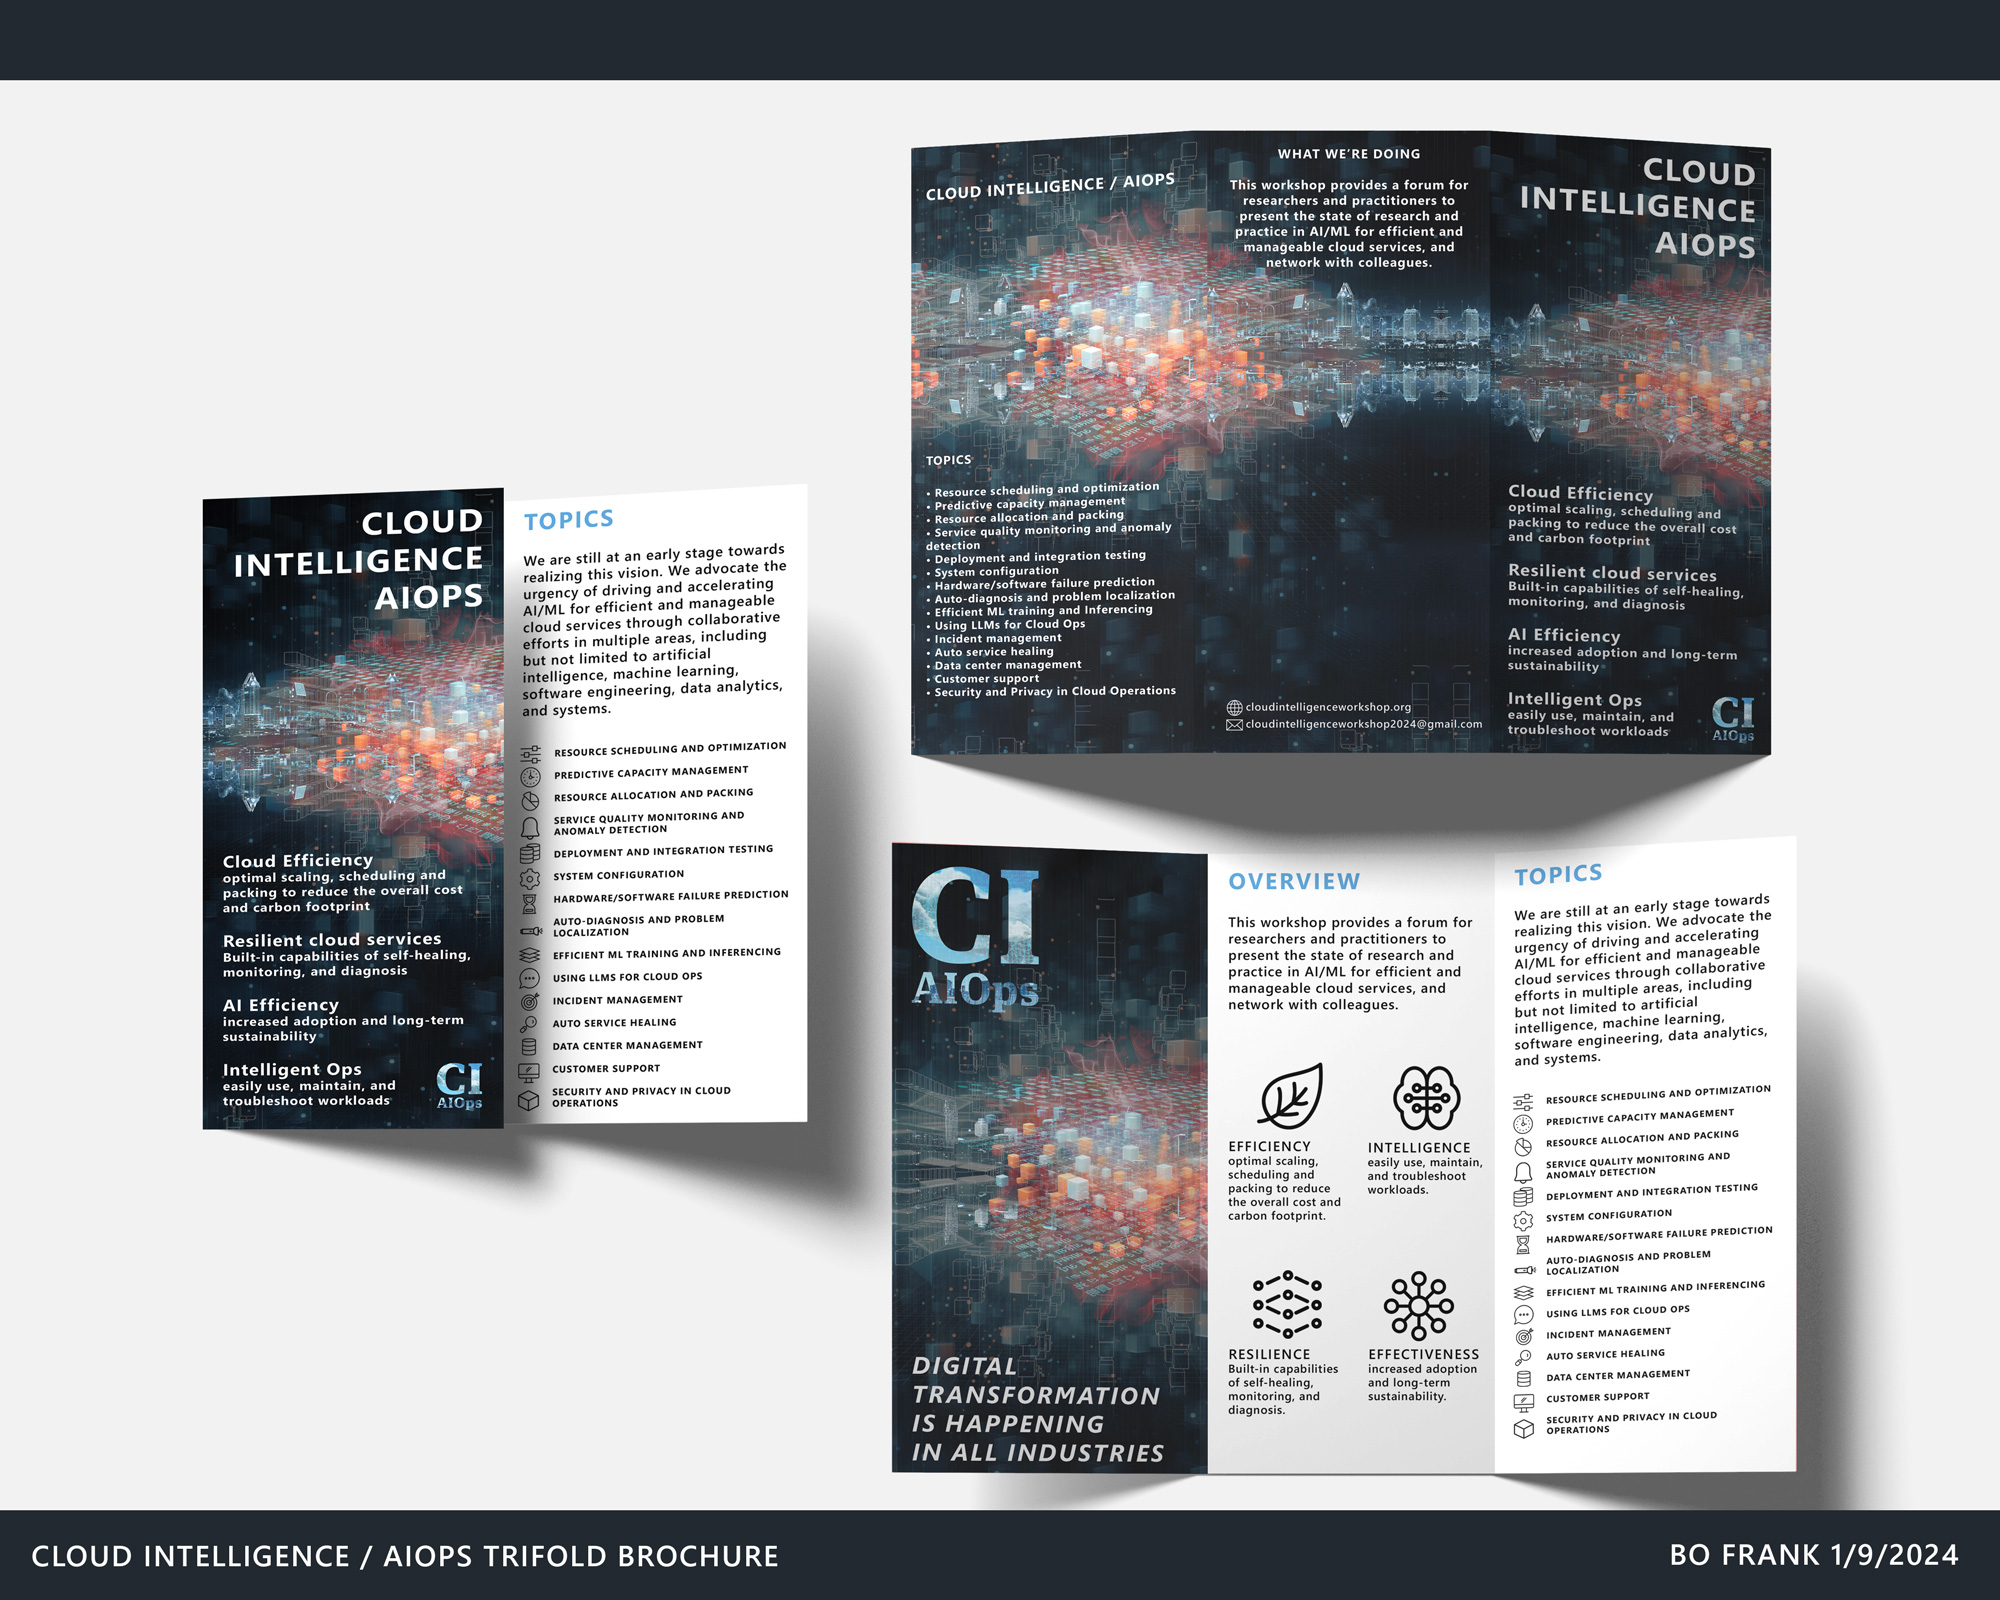
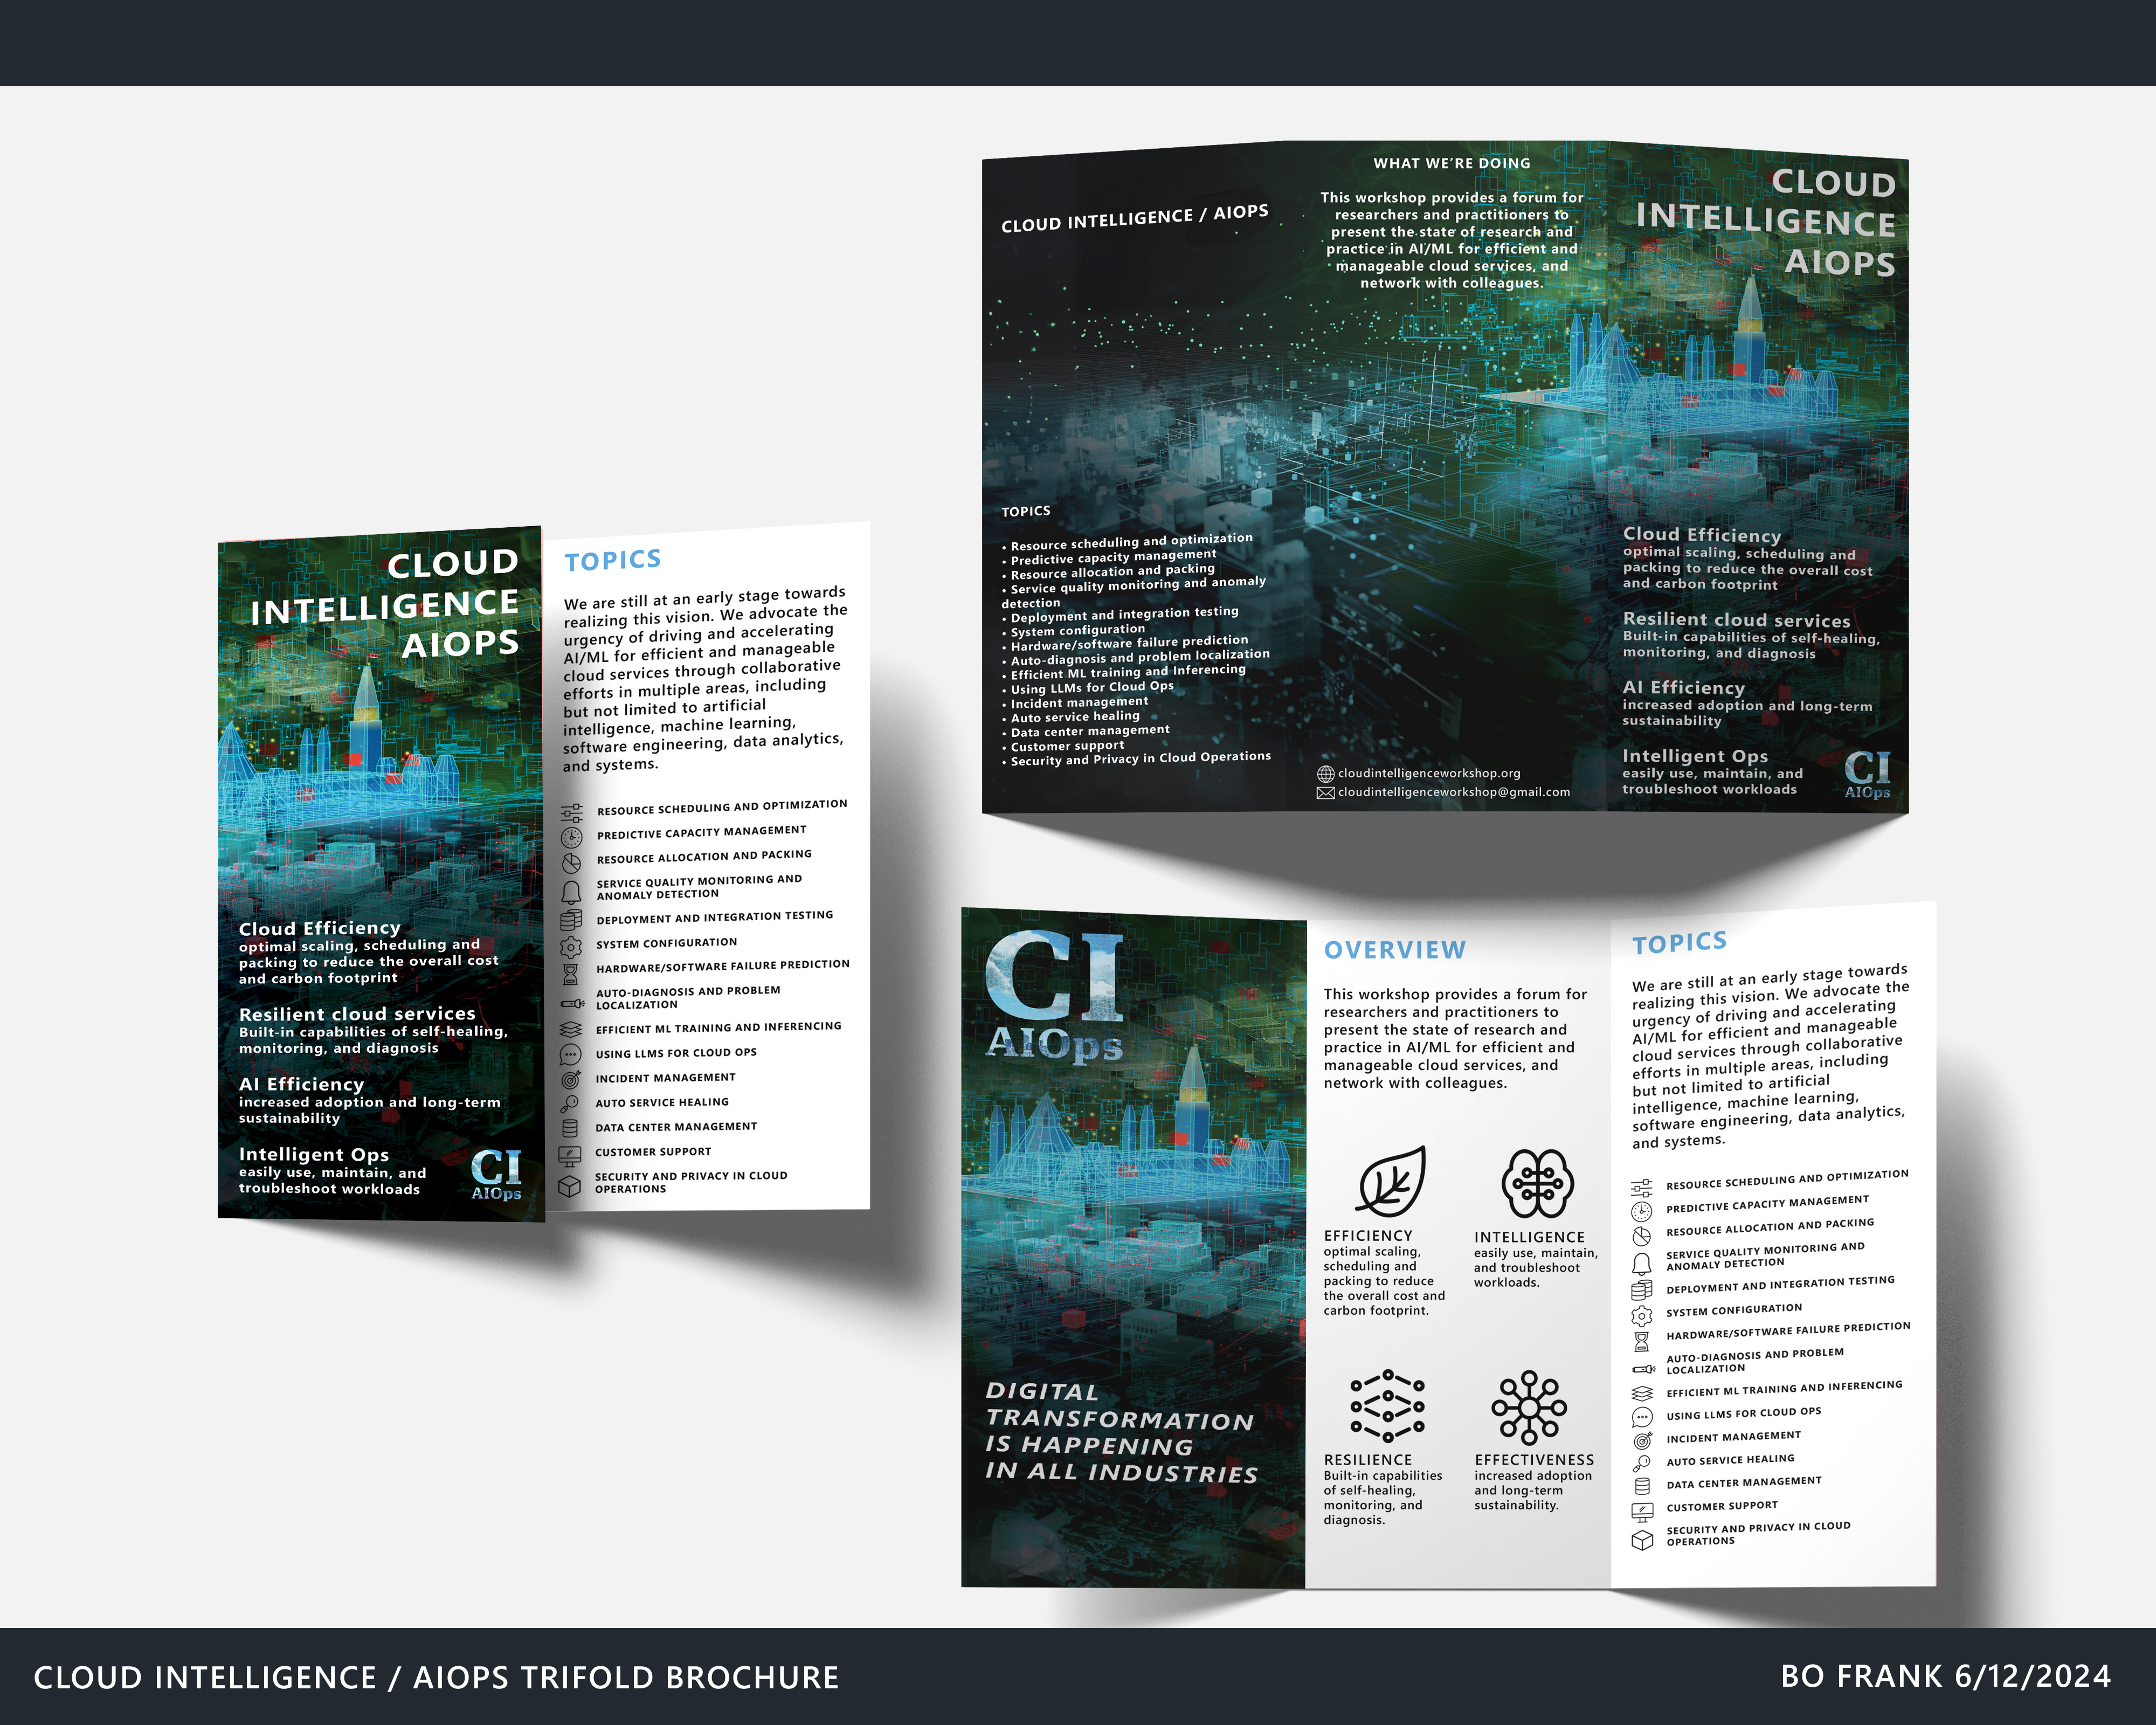
AIOps Conference Workshop Brochures
Role: Designer, Developer, and Analytics
Tools: Adobe Illustrator, Photoshop, Blender, Figma
-
Challenge: Recruiting Team Members
No existing physical brochure to be handed out during the conference.
-
Process: Using My Design Guide to Create Brochures
I used Adobe Illustrator, Photoshop, and Blender to design a brochure that is easy to read, has concise information and consistent graphics that match the workshop’s brand in the context of the conference. The graphics for the brochure were first made by hand then used as a prompt for AI as an iteration or at least an idea of the final image. The final product was delivered in PDF format ready for print.
-
Outcome: Increased awareness and participation
My brochure helped to increase awareness of the team and participation in the workshop. Overall, the project was a success and demonstrated my ability to create effective marketing materials for academic conference workshops.
Impact and Results
85%
Engagement
Audience interaction across the redesigned website and social media campaign
Why it matters: Reflects how effectively the new design and analytics strategy captured the scientific community’s attention.
- Website average session duration: 4.2 minutes (up from 1.8 minutes)
- Social media click-through rate: 7.5% (up from 3.2%)
- Page views per visitor: 3.9 pages (up from 1.7)
73%
Registration Increase
Total workshop and conference registrations following the site overhaul and brochure launch
Why it matters: Directly measures the success of the improved user experience and marketing materials.
- Pre-redesign monthly registrations: 240
- Post-redesign monthly registrations: 415
- Year-over-year growth: +73%
56%
Papers Accepted
Number of research papers submitted and accepted for AIOps workshops
Why it matters: Indicates that better visibility and outreach attracted more quality contributions from the research community.
- Papers submitted: 120 (up from 75)
- Papers accepted: 68 (up from 40)
Acceptance rate maintained at ~56% to ensure quality
Can AI further this project?
The following are three concise ideas focusing on how AI can further this platform’s impact.
1. Predictive Engagement + Smart Personalization
Integrating machine learning models into the conference websites could predict visitor behavior and surface the most relevant content automatically such as recommending specific sessions, papers, or networking opportunities based on a user’s browsing history and research interests.
Impact: Higher registration conversion rates, longer session durations, and personalized email campaigns that dynamically adjust to audience preferences.
Suggested AI Tool: Abacus.AI
2. AI-Driven Content Generation + Design Iteration
Generative AI tools (like large language models and image generators) can help rapidly prototype new design assets, social media posts, and workshop collateral. By training on past successful campaigns and engagement data, AI could suggest color palettes, hero images, and messaging optimized for the scientific audience.
Impact: Faster design cycles, consistent brand voice, and measurable improvements in click-through rates across campaigns.
Suggested AI Tool: Adobe Firefly
3. Automated Analytics + Real-Time Strategy Shifts
An AI-powered analytics pipeline could move beyond static reports to provide real-time insights and recommendations. For example, anomaly detection could flag sudden drops in engagement, while natural-language dashboards explain trends and propose next steps such as adjusting ad spend or tweaking site layout on the fly.
Impact: Quicker response to audience behavior, sustaining the 73% registration growth and enabling even higher year-over-year increases.
Suggested AI Tool: Dynatrace or Lightup.ai